At CollabDays Bremen this year, one session stood out for its clarity, practicality, and truth‑telling about a challenge many AI teams quietly struggle with. Katerina Chernevskaya delivered a deeply insightful talk on a topic that is easy to overlook in Conversational AI projects: how to actually measure user experience.
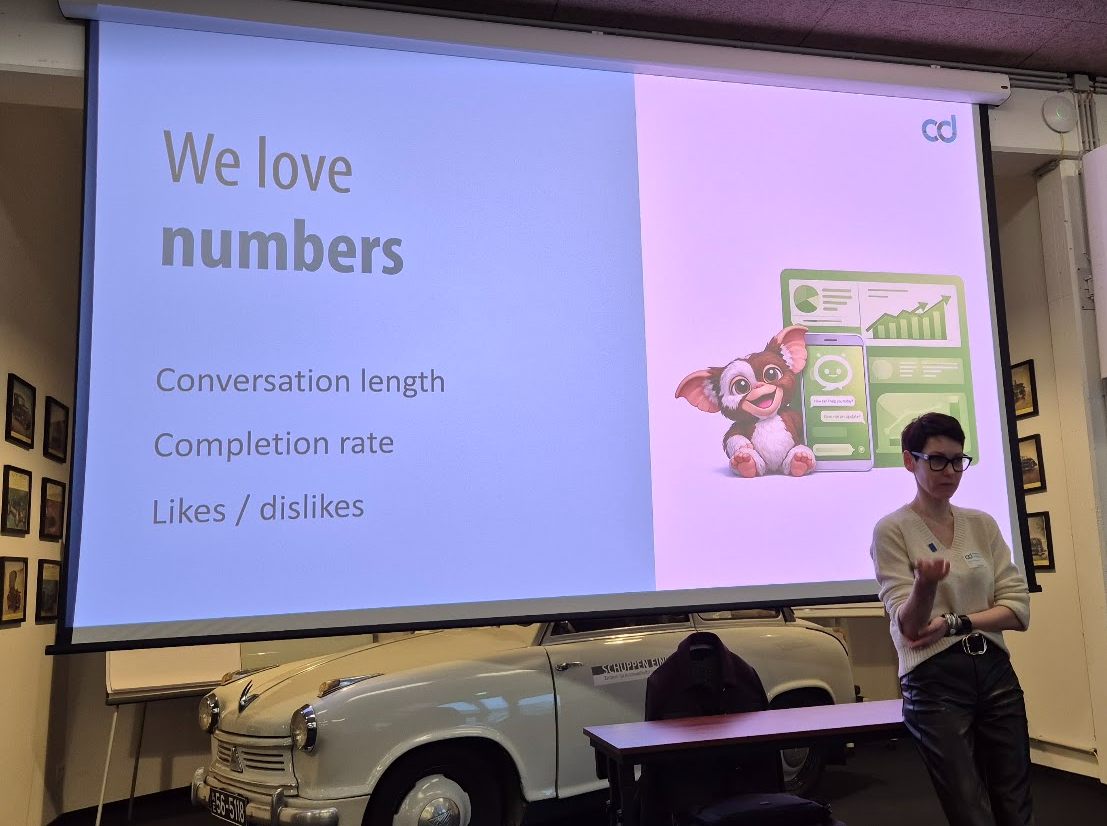
On paper, chatbots often look successful. Dashboards filled with conversation counts, session lengths, likes, dislikes, and token consumption can create a comforting illusion of progress. But as Chernevskaya demonstrated, these surface‑level metrics are often meaningless without context. Worse—they can be misleading.
This post distills what I learned from her session and demonstrates why teams need to move beyond vanity metrics and start analyzing conversational behavior at a deeper, more structural level. Using Copilot Studio, Application Insights, and Power Automate Process Mining, Chernevskaya showed how to turn raw chat telemetry into a true “DNA map” of user behavior.
The Problem With Conversations: Long ≠ Good, Short ≠ Efficient
Traditional application UX is relatively linear. We have screens, buttons, forms, events, and a clearly defined “happy path.” Measuring user behavior is straightforward.
Conversational AI is… not.
A single chatbot session can include:
- Questions
- Re‑phrased questions
- Clarifications
- Dead ends
- New, unrelated topics
- Emotional reactions
- Accidental triggers
- Unfinished threads
As Chernevskaya emphasized during her talk, metrics like conversation length, turns per session, and likes/dislikes tell us almost nothing about the true user experience.
Long sessions:
- Are users engaged?
- Or completely stuck?
Short sessions:
- Did the bot answer efficiently?
- Or did the user give up?
Likes/Dislikes:
If a user spends 20 minutes struggling through a conversation and clicks “Like” at the very end…
What does that like actually reflect?
Only the final response?
The whole journey?
Or just politeness?
Most users skip feedback anyway, making likes/dislikes statistically unreliable.
Chernevskaya summarized it perfectly:
“Without context, metrics become noise.”
From Metrics to Signals: A New Approach
To understand what truly happens inside a conversation, we need to analyze signals, not just counts.
These signals can include:
- When a user is clarifying
- When they’re reframing
- When they’re switching topics
- When they’re expressing confusion
- When they’re exploring
- When they’re providing more data
- When they’re stuck in a loop
- When they’re closing the session
These events tell us far more about user experience than raw numbers ever can.
In her demo, Chernevskaya presented a clever method:
use AI to classify every user message inside Copilot Studio before storing it as telemetry.
Essentially, AI judges AI.
Embedding an AI Classifier in Copilot Studio
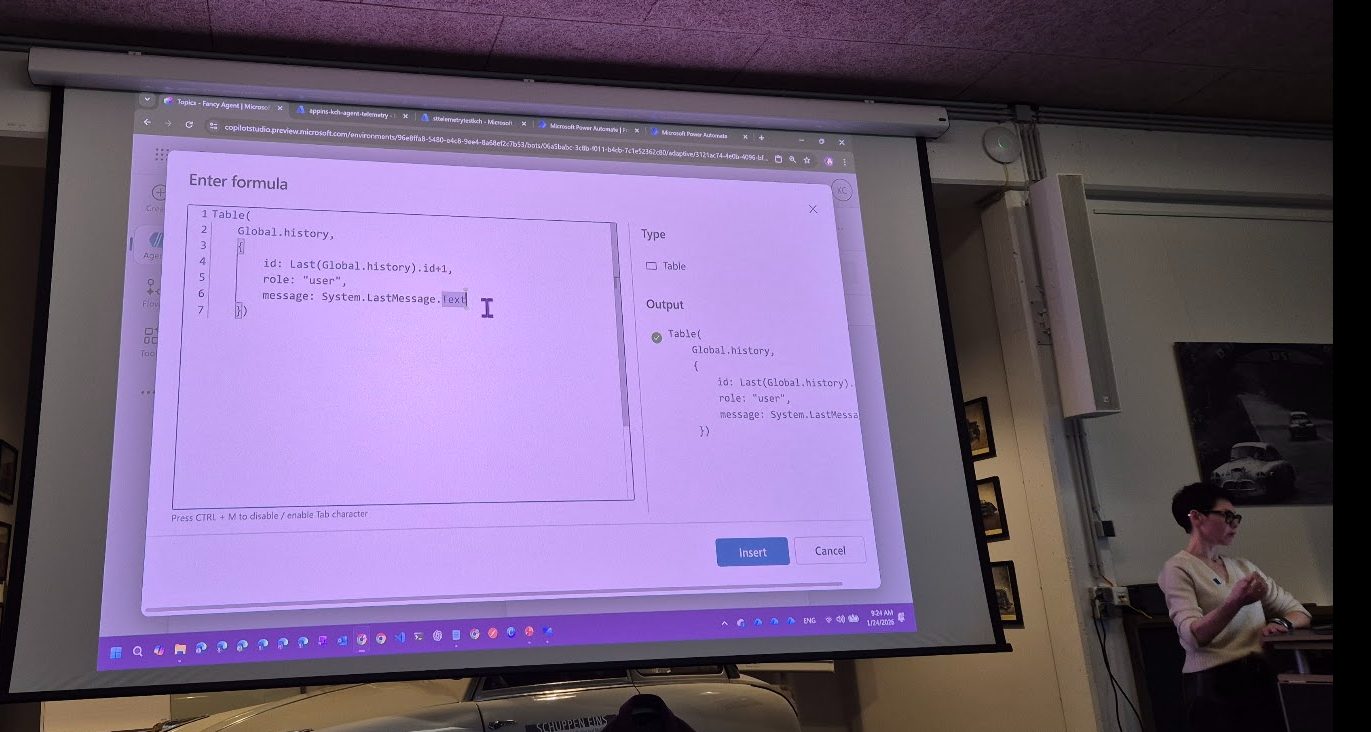
Using a combination of:
- A short‑term memory stored in global variables
- A structured prompt
- A JSON schema defining classification categories
…the agent can label each user message with a specific category.
Common categories in her example included:
- New Topic
- Clarification
- Rephrasing
- Data Provided
- Action Required
- Confirmation
- Frustration
This classification prompt runs every time a user sends a message. The model looks at the entire conversation context and categorizes the last user message only.
Why only the last message?
Because that’s the piece of information we want to analyze in sequence. The classification becomes a building block for reconstructing the conversation flow.
All of this is then stored as part of the conversation “history” variable and sent to telemetry.
Application Insights as the Single Source of Truth
Once the classification logic is in place, the next step is storing all this enriched data into Azure Application Insights.
Chernevskaya demonstrated how:
- Every agent message
- Every user message
- The assigned classification
- The conversation ID and session ID
- Short‑term context memory
- Model reasoning (optional)
…can be streamed to Application Insights as custom events.
This matters because Application Insights becomes the centralized operational and behavioral analytics layer. It already collects performance metrics, latency, failures, and system events. Layering user‑experience classifications on top of that creates a holistic telemetry dataset.
Developers can then use KQL (Kusto Query Language) to explore:
- Repeated frustration moments
- Unexpected topic switches
- Message patterns that trigger confusion
- Tool calls that consistently fail
- Hidden bottlenecks invisible in standard dashboards
This is where you begin to see the real customer journey, not the imagined one.
Bringing the Data to Life: Power Automate Process Mining
The final and arguably most impressive piece of the solution was feeding classified telemetry into Process Mining.
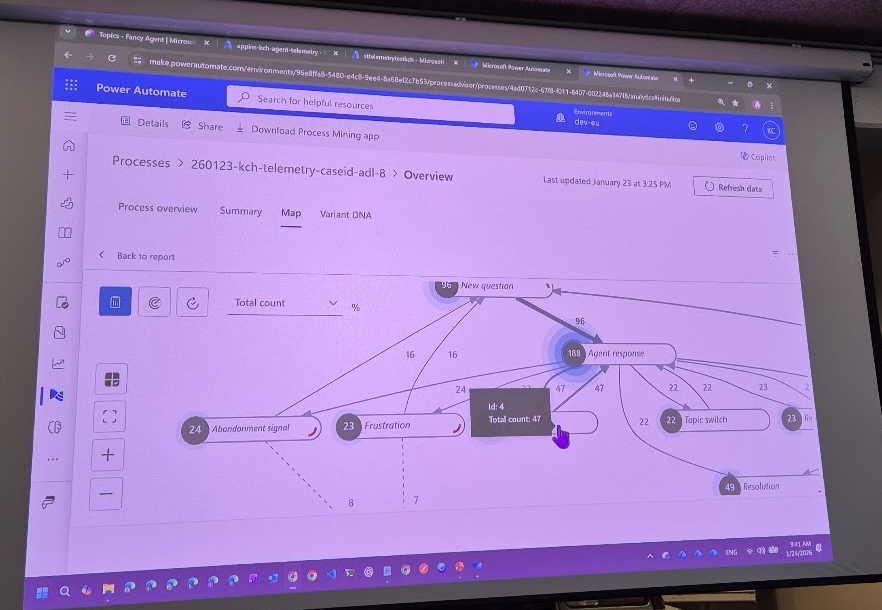
Because Application Insights currently cannot export large datasets directly for this purpose, Chernevskaya used Azure Storage as a middle layer. Logs are exported into TSV/CSV files, which Process Mining can ingest.
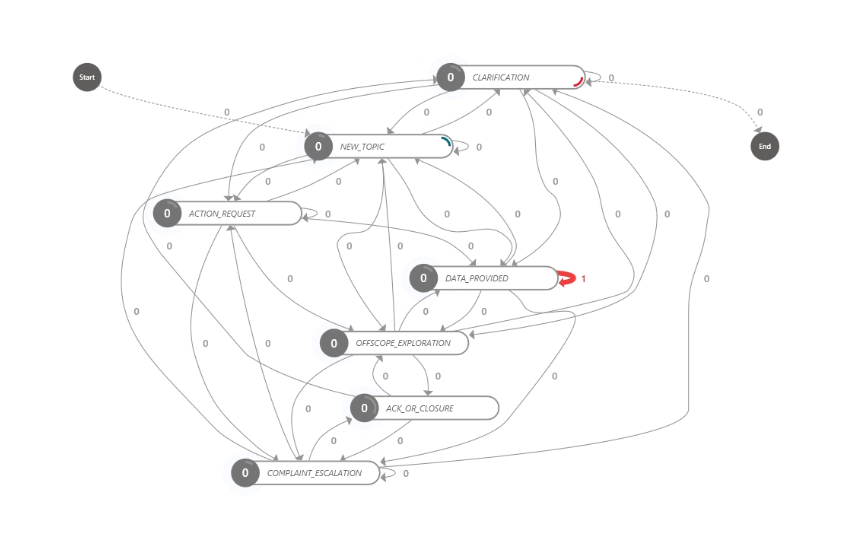
The result?
A visual “DNA map” of conversational behavior.
Not a list.
Not a chart.
A dynamic process diagram showing:
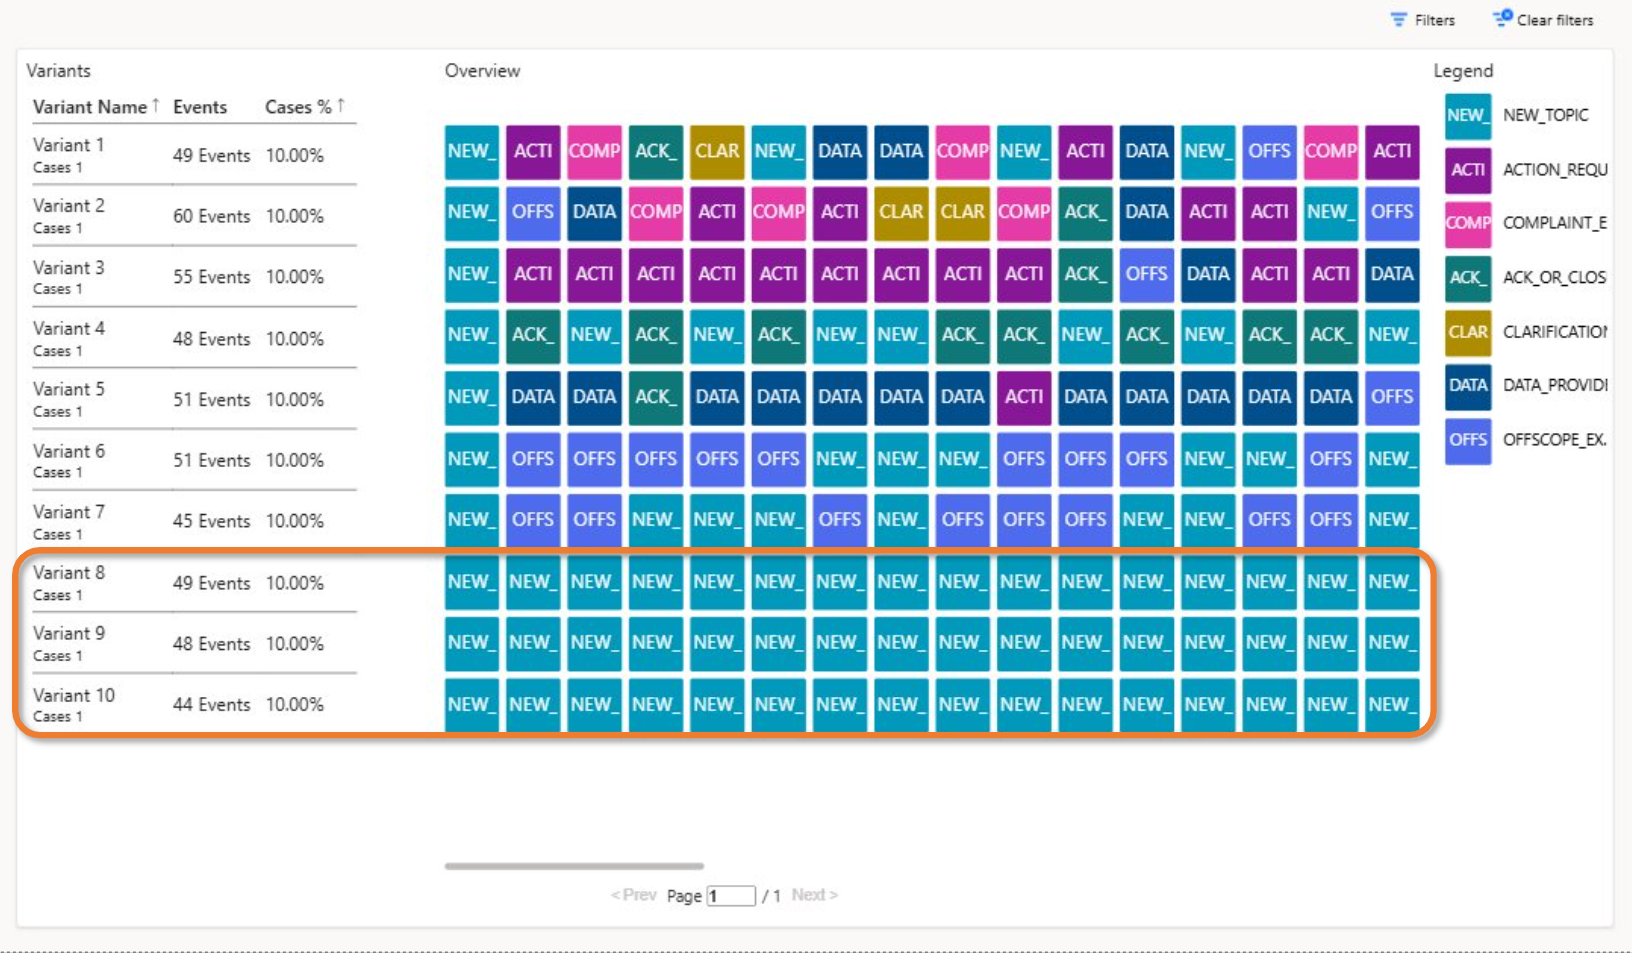
- The most common conversational paths
- Branching behaviors
- Points where users switch topics
- Loops of repeated clarifications
- Unexpected dead ends
- Exploration patterns of new users
- Frustration hotspots
- Conversations that never reach closure
In the demo, examples included:
1. Pure exploration flows
Users bouncing between new topics, exploring the bot’s capabilities.
This often happens early in a project and indicates curiosity—not failure.
2. Frustration loops
Where users rephrase multiple times, provide data, get stuck, and retry.
These patterns demand design intervention.
3. Clean “happy‑path” flows
Short sequences:
New Topic → Data Provided → Response → Closure
These are the ideal journeys.
4. Unexpected “noise” paths
Mixed patterns such as:
New Topic → Clarification → Rephrasing → New Topic → Close → Reopen
These highlight UX learning gaps: users might not know when a conversation is finished.
With this map, product teams can finally see the invisible architecture of user behavior.
Why This Matters: ROI, Satisfaction, and Better Design
Chernevskaya’s biggest message was that teams are often optimizing blindly. They focus on token costs, conversation lengths, and user ratings while missing the structural issues inside conversations.
This new approach enables:
✔ Data‑driven design decisions
No more guessing why a bot performs poorly.
✔ Real insights into user satisfaction
Not based on likes, but on behavioral signals.
✔ Identification of bottlenecks
Where users repeatedly get stuck or confused.
✔ Prioritization of improvements
Fix what actually affects users—not what dashboards pretend is important.
✔ ROI justification
Clear evidence of where agent behavior is efficient, effective, or wasteful.
✔ A scalable method for continuous improvement
No manual analysis of chat transcripts required.
Conclusion: The Future of Conversational Metrics
The takeaway from Chernevskaya’s session is simple but transformative:
If we want to improve conversational AI, we must understand how users actually converse—not how we imagine they do.
By embedding classification logic directly in Copilot Studio, storing enriched telemetry in Application Insights, and mapping conversation flows with Process Mining, organizations can finally uncover the real user experience hidden beneath surface‑level metrics.
It’s a shift from counting interactions to interpreting them.
From dashboards to understanding.
From “likes” to insights.
And once you see conversation DNA visualized, you can never go back to traditional metrics again.